What Is a Percentile? (Definition)
Imagine 100 people lining up in order of height, shortest to tallest. The person standing at position 60 is taller than exactly 60 people — they are at the 60th percentile. The person at position 99 is taller than 99 out of 100 — 99th percentile. The concept does not change whether the dataset has 100 values or 100,000.
According to the NIST/SEMATECH e-Handbook of Statistical Methods, percentiles are one of the most widely used tools for summarizing data distributions because they require no assumption about the underlying distribution shape. A raw score needs context to be meaningful; a percentile rank carries that context built in.
The Percentile Symbol
How Percentiles Are Written
The kth percentile is written as Pₖ or Pk in statistical notation. So the 90th percentile is P90, the 50th is P50, and so on. You may also see Q1, Q2, Q3 for quartiles (equivalent to P25, P50, P75) and D1–D9 for deciles (P10–P90). All are percentile notation variants.
- Scale: 0 to 100 (never above 100, almost never exactly 0)
- Percentile rank formula: PR = (# below ÷ n) × 100
- 50th percentile: Always equal to the median of the dataset
- Quartiles as percentiles: Q1 = P25, Q2 = P50 (median), Q3 = P75
- Interquartile range: P75 − P25, covers the middle 50% of data
- Interpretation depends on context: The same value can produce very different percentiles in different reference populations
What Each Percentile Rank Means
The most searched percentile questions are about what specific ranks actually mean. Here is a plain-English explanation for every common percentile, along with real-world examples you'll recognize.
A value at the 10th percentile is higher than only 10% of the dataset — 90% of values are above it. In salary data, P10 marks the bottom earners. In growth charts, a child below P10 is typically flagged for follow-up.
The 25th percentile — also called the first quartile (Q1) — means a value exceeds 25% of the group. It marks the lower boundary of the middle 50% of data. Scores here are generally considered below average.
The 50th percentile is the median — exactly half of all values fall below it and half above it. It is the mathematical center of any dataset. A score at P50 is squarely average within the comparison group.
The 55th percentile means a value beats 55% of the group — slightly above average. It indicates you are performing modestly better than the midpoint but not yet in the clearly above-average range (P75+).
The 60th percentile means a value is higher than 60% of all values in the dataset. It falls in the above-average zone. A student scoring at the 60th percentile on a test outscored 60 out of every 100 classmates.
The 68th percentile means the value exceeds 68% of the group. In a normal distribution, P68 corresponds approximately to one standard deviation above the mean — a well-known statistical benchmark.
The 70th percentile means a value is higher than 70% of the comparison group. Only 30% of values in the dataset exceed it. P70 is well into above-average territory across most performance metrics.
The 75th percentile — the third quartile (Q3) — means a value beats 75% of the dataset. It is the upper edge of the interquartile range. Salaries "at the 75th percentile" mean only 25% of comparable workers earn more.
The 80th percentile means a value exceeds 80% of all values — only 20% are higher. This is strong performance. A job candidate at the 80th percentile on a skills test is in the top fifth of applicants.
The 85th percentile means the value is higher than 85% of the group. On CDC growth charts, P85 is an important threshold — children between P85 and P95 for BMI are classified as overweight.
The 90th percentile means a value is higher than 90% of all values — only the top 10% are above it. This is excellent performance in nearly any context. On the GRE Verbal section, P90 corresponds to a score of 163 (ETS 2022–23 data).
The 95th percentile — called "p95" in tech performance monitoring — means only 5% of values are higher. In server response time, p95 is the standard threshold for user-experience quality assurance.
The 99th percentile means a value is higher than 99% of the dataset — only 1 in 100 values are above it. On competitive tests like the LSAT, this is the practical performance ceiling.
A child whose height is at the 60th percentile on a U.S. CDC chart would be at a completely different percentile on a chart built for a different country, because average heights differ across populations. Always confirm the reference group before interpreting any percentile ranking.
Is a Higher or Lower Percentile Better?
This is one of the most common percentile questions — and the answer is it depends on what you're measuring. There is no universal rule, because percentiles just measure rank. The direction that represents "better" depends entirely on whether a higher value in the underlying metric is desirable.
When a Higher Percentile Is Better
For most familiar metrics — test scores, income, athletic performance, IQ — a higher value is a better value, so a higher percentile is better. A job candidate at the 90th percentile on a coding assessment is objectively rare and desirable. A student at the 95th percentile on the SAT has outperformed 19 out of 20 test-takers.
When a Lower Percentile Is Better
For metrics where less is better — wait times, error rates, disease rates, response latency — a lower percentile signals excellent performance. A hospital whose average patient wait time is at the 10th percentile among regional hospitals is delivering faster care than 90% of comparable facilities. The 10th percentile is excellent here.
| Metric | Higher Percentile = Better ✓ | Lower Percentile = Better ✓ |
|---|---|---|
| Standardized test scores | P90+ = top performer | — |
| Salary / income | P75+ = above most peers | — |
| Athletic performance (speed) | P90+ = elite | — |
| Hospital wait times | — | P10 = fastest 10% |
| Software error rate | — | P5 = nearly error-free |
| Disease prevalence per capita | — | P1 = healthiest country |
| API response latency (p95) | — | P50 = fast for half of users |
| BMI (pediatric) | — | P5–P84 = healthy range |
The Agency for Healthcare Research and Quality (AHRQ) reports hospital quality metrics at multiple percentiles precisely because different metrics favor different directions. A low percentile on "readmission rates" is good; a low percentile on "patient satisfaction scores" is bad. Direction is not optional context — it changes the entire meaning of the number.
1st Percentile vs 99th Percentile
In most test and performance contexts, the 99th percentile is dramatically better than the 1st percentile — it means outperforming 99% versus only 1% of the comparison group. The 1st percentile sits near the very bottom of the distribution; the 99th percentile is the practical ceiling. The only exception is metrics where the lowest performers are the most desirable (fewest errors, smallest wait times), in which case the 1st percentile could represent the best-performing group.
Percentile Classification: Low, Average, and High
In psychology, education, and clinical assessment, practitioners use standardized normative classification systems to label percentile ranges as below average, average, above average, and so on. These cutoffs are not absolute rules — they vary by test publisher and field — but the most widely used system divides the distribution as follows:
| Percentile Range | Classification Label | Common Usage |
|---|---|---|
| Below P2 | Extremely Low | Clinical flagging, neuropsychological assessment |
| P2 – P9 | Very Low / Borderline | Educational support referral, pediatric screening |
| P10 – P24 | Below Average | Indicates need for improvement in most academic/professional contexts |
| P25 – P74 | Average | The interquartile range; majority of a typical population |
| P75 – P89 | Above Average / High Average | Selective college admissions, competitive hiring |
| P90 – P97 | Superior / High | Top-tier performance; gifted program eligibility |
| P98+ | Very Superior / Exceptional | Elite talent identification; research outlier screening |
These classifications are widely used in neuropsychological testing — for example, the Wechsler intelligence scales use a very similar banding system. Educational institutions often use the P25–P75 band as the "average" range when setting cut scores for interventions or gifted program eligibility. Note that a score at the boundary of P10 and P25, for instance, will be classified differently depending on the specific test and organization using the norms.
The classification table above assumes a nationally representative normative sample. A score that falls in the "average" range on a national norm could be "below average" on a local norm drawn from a high-achieving school district, or "above average" on a norm from a lower-performing group. The label always reflects the specific comparison group used to build the norms.
Percentile vs. Percentage: What's the Difference?
This is the confusion that trips up more students than any other. The two terms share a root word and both use a 0–100 scale, but they measure completely different things.
What a Percentage Measures
A percentage is an absolute measure of accuracy or proportion. Scoring 72% on an exam means you answered 72 out of 100 questions correctly — full stop. It says nothing about how anyone else performed.
What a Percentile Measures
A percentile is a relative measure of rank. It requires knowing the distribution of everyone else's scores before it can be computed. There is no such thing as "the 72nd percentile" in a vacuum — it only exists once you know the full comparison group.
| Feature | Percentage | Percentile |
|---|---|---|
| What it measures | Fraction of total possible | Relative position in a group |
| Requires other scores? | No | Yes — needs full distribution |
| Maximum value | 100% (all correct) | ~99th (100th is practically impossible) |
| Example | "You got 84 out of 100 right" | "You outscored 84% of test-takers" |
| Changes if group changes? | No | Yes — same score, different group = different percentile |
Saying "I scored in the 90th percentile, so I got 90% of the questions right." These are unrelated statements. A student scoring 90th percentile on a hard exam might have only answered 60% of questions correctly — because everyone else scored even lower.
Percentile Formula: How to Calculate Percentiles
There are two common calculations. The first finds the percentile rank of a known value. The second finds the value at a target percentile.
Formula 1 — Percentile Rank of a Value
PR = Percentile Rank (0 to 100)B = Number of values strictly below your valuen = Total number of values in the datasetFormula 2 — Value at a Target Percentile
L = Location (position) in the sorted listP = Target percentile (e.g., 25, 50, 75, 90)n = Total number of valuesIf L is a whole number, the percentile value is the average of the values at positions L and L+1. If L is not a whole number, round up to the next whole number and use the value at that position. Different textbooks and software packages (Excel, Python, R) apply slight variations of this rule, which is why they can return marginally different results for the same dataset at the same percentile.
Step-by-Step Percentile Calculation Example
Dataset: Exam scores for 9 students
Raw scores: 42, 68, 55, 91, 77, 63, 88, 71, 55
Sort ascending: 42, 55, 55, 63, 68, 71, 77, 88, 91
There are n = 9 values total.
Find the percentile rank of score 77:
Count values strictly below 77: {42, 55, 55, 63, 68, 71} → 6 values.
PR = (6 ÷ 9) × 100 = 66.7th percentile
Find the value at the 75th percentile (Q3):
L = (75 ÷ 100) × 9 = 6.75 → round up to position 7.
Value at position 7 in sorted list = 77.
So P75 of this dataset = 77.
Find the 25th percentile (Q1):
L = (25 ÷ 100) × 9 = 2.25 → round up to position 3.
Value at position 3 = 55.
IQR = 77 − 55 = 22 points.
✓ Score 77 sits at the 66.7th percentile. Q1 = 55, Q3 = 77, IQR = 22. Median (P50, position 5) = 68.
| Position | Value | Values Below | Percentile Rank |
|---|---|---|---|
| 1 | 42 | 0 | 0th |
| 2 | 55 | 1 | 11.1st |
| 3 | 55 (tie) | 1 | 11.1st |
| 4 | 63 | 3 | 33.3rd |
| 5 | 68 | 4 | 44.4th |
| 6 | 71 | 5 | 55.6th |
| 7 | 77 | 6 | 66.7th |
| 8 | 88 | 7 | 77.8th |
| 9 | 91 | 8 | 88.9th |
Percentiles in Grouped Data
When data appears in a frequency table rather than as individual values, the formula uses interpolation:
L = Lower boundary of the percentile classk = Target percentile (e.g., 50 for median)n = Total frequencyF = Cumulative frequency before the classf = Frequency of the percentile classh = Class widthInteractive Percentile Calculator
Enter comma-separated values below. The calculator sorts your data, computes the percentile rank of any value you specify, and identifies the value at any target percentile — with a full step-by-step breakdown.
Percentile Calculator
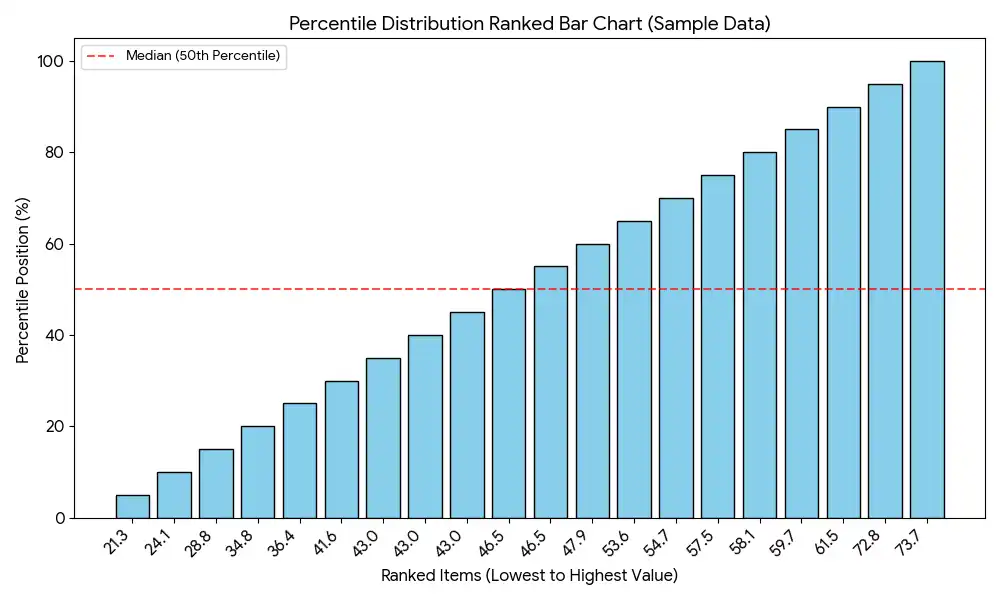
Percentile Rank Visualized
What Does the 90th Percentile Mean? (Visual Guide)
The 90th percentile is one of the most frequently asked-about points. A value at the 90th percentile is higher than 90% of all values in the comparison group — only the top 10% exceed it. On the GRE General Test, ETS reports that a Verbal Reasoning score of 163 corresponds to the 90th percentile among test-takers in the 2022–2023 testing year — meaning a student scoring 163 outscored nine out of ten candidates.
Interpreting Percentile Rank Correctly
Two datasets can produce wildly different percentile interpretations of the same score. A salary of $95,000 per year sits at the 76th percentile among all U.S. full-time workers, according to BLS data. But among software engineers in San Francisco, that same salary falls below the 25th percentile. Neither number is wrong — they reflect different crowds. The interpretation changes entirely when the reference group changes.
Quartiles, Deciles, and Percentiles
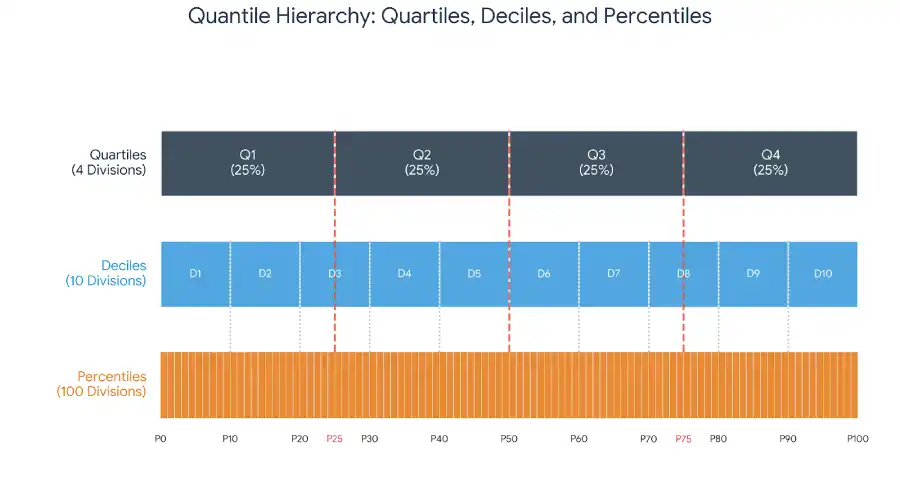
Percentiles, quartiles, and deciles are all methods of dividing an ordered dataset into equal-sized groups. They differ only in how many groups they create.
Quartiles Explained
Quartiles split a sorted dataset into four equal parts using three cut points: Q1, Q2, and Q3. These three values are simply the 25th, 50th, and 75th percentiles. The interquartile range (IQR) — the distance between Q1 and Q3 — captures the middle 50% of the data and is the go-to measure of spread when outliers are present.
Deciles Explained
Deciles divide data into ten equal parts using nine cut points (D1 through D9). D1 equals the 10th percentile; D9 equals the 90th percentile; D5 is the median. Income economists use deciles regularly — a common description is "the top income decile" (D9 and above), referring to households earning more than 90% of the population.
| Measure | Splits Data Into | Cut Points | Equivalent Percentiles |
|---|---|---|---|
| Quartiles | 4 equal parts | Q1, Q2, Q3 | P25, P50, P75 |
| Deciles | 10 equal parts | D1 through D9 | P10, P20, P30 … P90 |
| Percentiles | 100 equal parts | P1 through P99 | — (they are percentiles) |
| Median | 2 equal halves | One point | P50 = Q2 = D5 |
Real-World Percentile Examples
Standardized Test Percentiles (SAT)
Standardized tests use percentile ranks because raw scores are hard to compare across test administrations. The College Board recalibrates SAT percentiles annually using scores from the preceding cohort.
| SAT Total Score | Approx. Percentile | Interpretation |
|---|---|---|
| 1550 – 1600 | 99th | Top 1% of all test-takers |
| 1450 – 1549 | 96th – 98th | Top 4% |
| 1350 – 1449 | 90th – 95th | Top 10% |
| 1200 – 1349 | 74th – 89th | Above average |
| 1060 – 1199 | 50th – 73rd | Average range |
| 900 – 1059 | 27th – 49th | Below average |
| Below 900 | Below 27th | Lower quarter |
Source: College Board, 2024 SAT Suite of Assessments Annual Report. Percentile ranges are approximate composites across all SAT administrations in the 2023–2024 school year.
Salary Distribution Percentiles
The Bureau of Labor Statistics publishes wage percentiles for 800+ occupational categories in its annual Occupational Employment and Wage Statistics survey. For registered nurses in 2023, the 10th percentile hourly wage was $26.36, the 50th (median) was $39.05, and the 90th percentile was $61.37. The 90th percentile nurse earns more than twice as much as the 10th percentile nurse — illustrating how much the distribution's shape is hidden by a single average wage figure.
Child Growth Percentiles
The CDC publishes sex-specific growth charts tracking weight, height, and BMI from birth through age 20. A pediatrician who sees a 4-year-old boy at the 95th percentile for weight is seeing a child who outweighs 95% of boys his age in the reference population — which, per CDC guidelines, triggers a conversation about healthy weight management.
CDC Clinical Growth Charts (2000)
The standard pediatric percentile references used by U.S. clinicians are available free from the CDC Division of Nutrition, Physical Activity, and Obesity. Charts cover the 3rd, 5th, 10th, 25th, 50th, 75th, 85th, 90th, 95th, and 97th percentiles for boys and girls separately.
Website Performance Percentiles (p95, p99)
Web performance teams use percentiles rather than averages to measure server response times. The industry standard benchmark is the 95th percentile response time (p95): if your API returns a response in under 200ms for 95% of requests, the slowest 5% of users are experiencing something worse. Google's Core Web Vitals use the 75th percentile of field data as the threshold for "good" performance — a decision explained in Google's public methodology documentation.
Common Percentile Mistakes
| Mistake | What People Say ✗ | What They Should Say ✓ |
|---|---|---|
| Percentile = Percentage | "I'm in the 90th percentile, so I got 90% right." | "I scored higher than 90% of the group — my raw score could be anything." |
| Percentile measures distance | "80th is twice as good as 40th." | Percentiles measure rank, not distance. The gap between 40th and 80th could be 2 points or 200 points. |
| Ignoring the reference group | "60th percentile is always fine." | 60th percentile relative to which reference group? That matters enormously. |
| Misreading growth charts | "My child dropped from 75th to 60th — something is wrong." | A single shift of 10–15 points is within normal variation. Track trends, not single readings. |
| Assuming 50th = average score | "50th percentile means scoring 50%." | 50th percentile means beating exactly half the group. The actual score value could be 30%, 65%, or anything. |
| Higher always means better | "We're at the 95th percentile for response time — great!" | For response time, being at the 95th percentile means you're slower than 95% of systems — that's poor performance. |
Percentiles and the Normal Distribution
Bell Curve and Percentiles
When data follows a normal distribution, the relationship between the mean, standard deviation, and percentile is exact and predictable. The mean sits at the 50th percentile. One standard deviation above the mean corresponds to the 84.1st percentile. Two standard deviations above is the 97.7th percentile.
Z-Scores and Percentiles
A z-score tells you how many standard deviations a value sits above or below the mean. In a normal distribution, every z-score maps to a precise percentile via the standard normal table.
| Z-Score | Percentile Rank | Interpretation | IQ Example (μ=100, σ=15) |
|---|---|---|---|
| −2.00 | 2.3rd | Bottom 2.3% of normal curve | IQ ≈ 70 |
| −1.00 | 15.9th | One SD below mean | IQ ≈ 85 |
| 0.00 | 50th | Exactly the mean | IQ = 100 |
| +1.00 | 84.1st | One SD above mean | IQ ≈ 115 |
| +1.28 | 90th | Top 10% | IQ ≈ 119 |
| +1.65 | 95th | Top 5% | IQ ≈ 125 |
| +2.00 | 97.7th | Top 2.3% | IQ ≈ 130 |
| +2.33 | 99th | Top 1% | IQ ≈ 135 |
Percentile Formula Glossary
| Term | Symbol/Formula | Plain-English Meaning | Common Misunderstanding |
|---|---|---|---|
| Percentile Rank | PR = (B/n)×100 | Percent of values that fall below a given value | Confused with the raw score percentage |
| Percentile Locator | L = (P/100)×n | Position in a sorted dataset for a target percentile | L is a position, not a score |
| Median | P50 = Q2 = D5 | Middle value — half below, half above | Assumed to equal the mean; only true in symmetric distributions |
| Quartiles | Q1=P25, Q2=P50, Q3=P75 | Three cut points dividing data into four equal sections | Confused with the sections themselves; quartiles are the cut points |
| IQR | Q3 − Q1 | Width of the middle 50% of a distribution | Thought to describe all of the data; it covers only the central half |
| Deciles | D1=P10 … D9=P90 | Nine cut points dividing data into ten equal sections | D9 = P90, not P99 |
| Quantile | General family | Any cut point that divides a distribution into equal-probability sections | Used interchangeably with "percentile" — quantile is the broader term |
| Percentile Range | Pₐ − Pb | Difference between two specified percentiles; the 10–90 percentile range is most common | Confused with IQR; the percentile range can span any two percentiles, not just Q1 to Q3 |
Practice Problems
A class of 20 students scores as follows on a chemistry test:
45, 52, 58, 61, 63, 67, 70, 72, 72, 74, 75, 78, 80, 83, 85, 87, 90, 92, 95, 98
Question: What is the percentile rank of a score of 80?
Data is already sorted. n = 20.
Count values strictly below 80: {45, 52, 58, 61, 63, 67, 70, 72, 72, 74, 75, 78} → 12 values
Apply the formula: PR = (12 ÷ 20) × 100 = 60th percentile
✓ A score of 80 sits at the 60th percentile in this class. Using the normative classification table above, P60 falls in the "Average" range (P25–P74). The student is performing slightly above the median but not yet in the above-average band.
Using the same 20-student dataset, find the value at the 90th percentile (P90).
Apply the locator formula: L = (90 ÷ 100) × 20 = 18
L = 18 is a whole number, so average positions 18 and 19.
Position 18 = 92, Position 19 = 95.
P90 = (92 + 95) ÷ 2 = 93.5
✓ The 90th percentile value in this dataset is 93.5. Only 10% of students (2 students) scored above this point. Using the normative table, this falls in the "Superior / High" classification band.
Frequently Asked Questions About Percentiles
The 90th percentile (P90) means a value is higher than 90% of all values in the dataset — only the top 10% are above it. On the GRE, a P90 Verbal score corresponds to approximately 163. In salary data, the P90 wage means only 10% of workers in that occupation earn more. It is generally considered excellent performance in any context where higher is better.
Yes — in almost any context where higher scores are better, the 90th percentile is excellent. It places a value in the top 10% of the entire comparison group. On standardized tests, competitive exams, salary benchmarks, and performance reviews, reaching P90 is a strong result by virtually any standard. The only exception is metrics where lower is better (error rates, wait times), in which case P90 signals the worst performers.
It depends on the metric. For test scores, income, and performance where more is better, higher percentiles are better. For wait times, error rates, and disease prevalence where less is better, lower percentiles are better. Always identify the desired direction of the underlying metric before interpreting whether a percentile is "good" or "bad."
The 60th percentile means the value is higher than 60% of all values in the comparison group. It sits above the median (P50) and falls in the above-average to average range, depending on the normative classification system used. A student at P60 outscored 60 out of every 100 classmates — modestly above the midpoint but not yet in the top quarter.
The 80th percentile means the value exceeds 80% of the dataset — only 20% of values are higher. This is firmly in the above-average range and, in most normative systems, approaches the "High Average" or "Above Average" classification band (P75–P89). For salary data, P80 means earning more than 80% of peers in the same role.
The 50th percentile — the median — is the mathematical center. Most normative classification systems consider the range from the 25th to 75th percentile to be the "Average" band. Values below P25 are classified as below average; values above P75 as above average. These thresholds shift slightly depending on the specific test publisher or clinical assessment system.
Yes, exactly. The 90th percentile means 90% of values fall below — so only the top 10% of values are above it. Being at or above the 90th percentile places you in the top tenth of the comparison group. This is why "90th percentile" and "top 10%" are used interchangeably in most practical contexts.
Yes. The 99th percentile means the value exceeds 99% of all values in the dataset — only 1 in 100 is at or above that level. On competitive standardized tests like the LSAT or GRE, reaching the 99th percentile is the practical ceiling of performance and an exceptional result in any scoring context.
A z-score measures how many standard deviations a value sits from the mean and can range from −∞ to +∞. A percentile rank is bounded between 0 and 100. In a normal distribution, z-scores and percentiles are mathematically interconvertible via the standard normal table — z = +1.28 corresponds to the 90th percentile. Outside a normal distribution, the same z-score could correspond to a different percentile depending on how skewed the data is.
No. Using the standard formula PR = (B ÷ n) × 100, the highest-scoring person has all other values below them, so B = n − 1. Their percentile rank = ((n−1) ÷ n) × 100, which approaches but never reaches 100. In a dataset of 10, the top scorer reaches the 90th percentile; in a dataset of 100, the 99th. Some alternative formulas use (B + 0.5) ÷ n × 100 (the midpoint method), which similarly never produces exactly 100th.
Key Takeaways
- Percentiles measure rank, not score. The 90th percentile means a value beats 90% of the group — it says nothing about the raw score.
- Higher vs. lower depends on the metric. For test scores and income, higher is better. For error rates and wait times, lower is better.
- The 50th percentile = median. Q1 = P25, Q2 = P50, Q3 = P75 — always.
- Average range = P25 to P75. This is the interquartile range; the central 50% of any distribution.
- The reference population is non-negotiable. The same value can be P60 in one group and P30 in another.
- P90 = top 10%; P99 = top 1%. These equivalences are exact — not approximations.
- Large samples produce reliable percentiles. With fewer than 30 data points, treat individual percentile ranks cautiously.
For a broader foundation, the descriptive statistics home page connects percentiles to the mean, median, mode, standard deviation, and other core measures. Use the z-score to percentile visual tool to convert any z-score to its corresponding percentile rank instantly.